
Picture this: it’s 2001, Amazon has been operating for seven years, survived the dot-com crash, and Jeff Bezos has still not delivered a single full year of profit. Analysts have been calling the model into question for years. In shareholder meetings, the recurring question is always the same: when is this company going to stop burning money? Bezos’s answer, consistent every time, was that they would keep investing aggressively in infrastructure, logistics, and new categories. That profitability would come when they decided the moment was right.
Amazon operated at a loss for nearly seven years before becoming one of the greatest businesses in history. Spotify operated at a loss for 17 years. Tesla took a similar length of time to reach profitability.
None of them were in danger, they were building, and they had a plan.
Negative cash flow in startups is a number that keeps many first-time founders up at night. It sits in the cash flow statement, printed in red, and it goes by a deceptively alarming name. The instinct is to panic but understanding it is almost always the smarter move.
The Myth, Unpacked
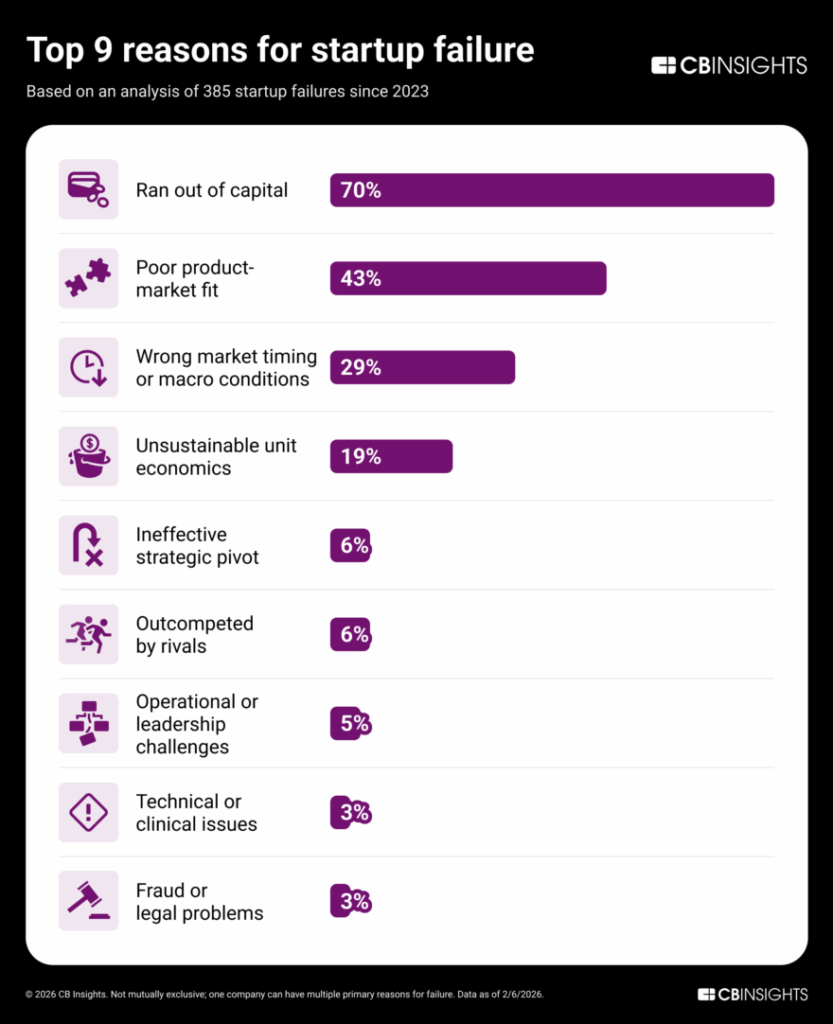
The fear has an intuitive logic to it: if more money is leaving the company than entering it, you are burning through your reserves. Do that long enough without a plan and the business dies. Cash flow problems remain one of the leading causes of startup failure. In its 2026 analysis, CB Insights found that 70% of failed startups ran out of capital, though the report notes this is almost always the final cause of death rather than the root problem: poor product-market fit, bad timing, and unsustainable unit economics are what typically dry up the capital in the first place.
But the myth lies in assuming that negative cash flow and poor financial health are synonymous. In the context of a venture-backed startup, they can mean something entirely different: that you are investing.
The Pattern Investors Actually Read: The J-Curve
Every venture-backed startup follows a recognizable shape. You start with negative cash flow from day one, burning capital to build the product, hire the team, and acquire the first customers. Early growth rarely generates returns immediately because it depends on initiatives that still need to be derisked: a GTM partnership channel, a new market, an AI-driven scaling motion across certain teams. Slowly, the numbers start improving. Then you raise a round and they dip again, because you are deploying that new capital aggressively into growth. Then the trend reasserts itself, and you climb again toward the next milestone.
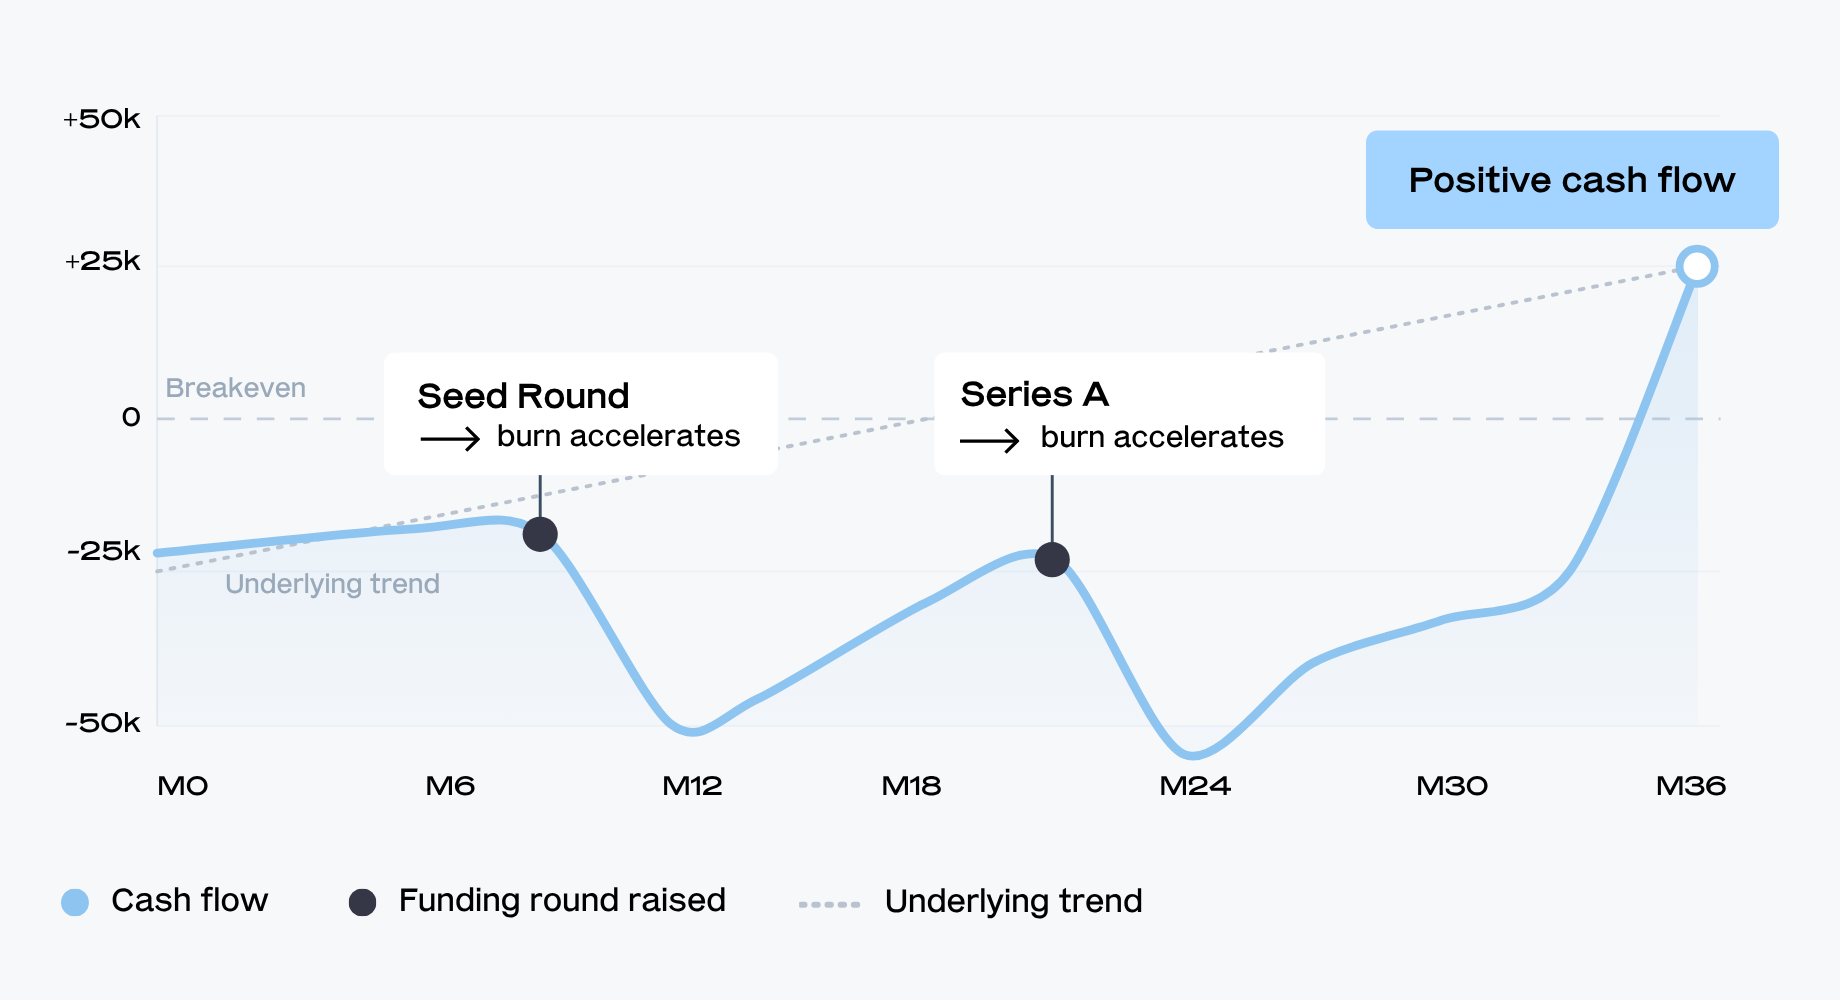
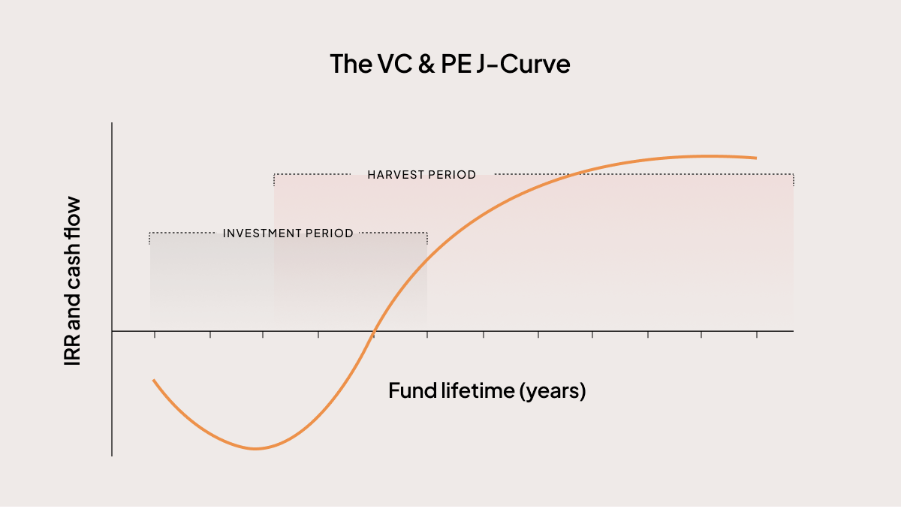
This pattern is often referred to as the J-curve, a term borrowed from private equity to describe how funds experience negative returns in early years before harvesting gains later. Applied to an individual startup’s cash flow trajectory, the analogy holds: an initial period of losses, followed by a sharp upward swing into growth once the company lands clients and successfully understands the mechanics of the different initiatives that were unknown before the round. For many startups, this curve is fully expected, and often a sign that things are working. What experienced investors are reading is not the absolute position on that curve, but the direction and slope of the underlying trend. A startup that is deeply cash flow negative but improving its unit economics and executing on milestones is exactly where it should be.
Technology ventures typically burn cash on user acquisition and product development before monetization kicks in. After finding product-market fit and closing a Series A, sales begin and growth accelerates. By the Series B raise, the company’s valuation has often climbed well above its seed-stage peak. The dip after each round means capital is being deployed.
Intentional Burn vs. Reckless Burn
Where the curve is headed matters, and how you are spending to get there matters equally. The healthiest startups treat burn as a design decision, calibrated to their stage, their ROI, and the milestones ahead. What each dollar buys in progress matters far more than the size of the number itself.
Every initiative should follow a clear rationale: capital deployed into headcount or marketing carries an expected return, primarily in the form of new clients, because the underlying goal is to grow sales in a way that progressively improves cash flow. A startup burning cash to hire engineers and acquire customers with strong lifetime value is doing something categorically different from one burning cash because its unit economics are broken. Both will show up in red on the statement, but only one of them is a problem. Strategic burn to gain market share and win customers is fundamentally different from everyday operational overspending.
The Metrics That Actually Tell the Story
If cash flow alone does not reveal whether a startup is healthy, what does? Experienced investors have been using the same handful of metrics for years.
Burn Rate
Burn rate is the starting point, but the number alone tells you little without context. What matters is whether the growth it is funding justifies the spend. After deploying resources, revenue and key growth metrics should improve in proportion to the burn. If they are not, the company is failing to recover its investment and the underlying curve is not inflecting. At that point the question becomes a management one: double down on the current approach, test something different, or get honest about what is not working.
Runway
Runway is the operational clock. The real danger is running out of runway before you reach your next milestone, whether that is the next funding round, a revenue inflection, or breakeven.
Burn Ratio
Burn ratio measures how many dollars you spend to generate one dollar of new annual recurring revenue. A burn ratio below 1 is excellent, 1 to 1.5 is great, 1.5 to 2 is acceptable, 2 to 3 is suspect, and above 3 is poor. A company can be deeply cash flow negative and still carry a burn ratio that signals efficient, disciplined growth. The formula divides net burn by net new ARR, both measured over the same period, typically a full financial year. Net burn is the company’s operating cash flow across those 12 months, and net new ARR is the annual recurring revenue at the close of the period minus the ARR at its start. The key is that both figures cover the same window, otherwise the ratio means nothing.
Unit Economics
Unit economics are the foundation underneath everything else. A healthy startup shows a customer lifetime value that exceeds the cost of acquiring them. If the math works at the customer level, scaling that engine with capital is a rational bet. If it does not, more spending only amplifies the problem.
A credible path to improving unit economics is perhaps the most important signal of all. The most believable models show a clear path from negative unit economics to breakeven to optional profitability. A startup that can articulate that path and then execute against it is in a fundamentally different position from one that is simply spending without direction.
The Macro Context Founders Cannot Ignore
The tolerance for burn has changed, and understanding how sharpens everything above. In 2021, capital was cheap and investors funded growth with little regard for how efficiently it was bought. Entering 2026, capital efficiency is the language investors use to decide who gets funded, with metrics like burn multiple, CAC payback and the Rule of 40 now standard at every stage.
Andreessen Horowitz, one of the most influential funds in the industry, has been explicit that it reads burn multiple in the context of growth rather than as a standalone figure. A 2.0x burn multiple paired with 150% year-over-year ARR growth is investable, while the same 2.0x at 60% growth is not. More telling still, a company at 2.2x trending toward 1.8x is more fundable than one sitting flat at 1.6x for four quarters. The absolute number is secondary; the direction is what closes the round.
When Should You Actually Worry?
Negative cash flow in startups is a yellow flag, not a red one. It becomes genuinely dangerous under a specific set of conditions:
- When unit economics are deteriorating rather than improving with scale.
- When runway drops below 12 to 18 months with no clear path to the next funding milestone.
- When the burn multiple is stuck above 2 or 3 with no downward trend.
- When a product or service problem is quietly driving churn that will eventually reverse the trend.
- When cash flow negativity is driven by operational inefficiency rather than deliberate investment.
A curve going down only becomes a problem when there is no underlying upward trend. If you are heading into a fundraising round, the position that gives you the most negotiating leverage is a completed curve; you have executed on what you planned in the previous round, you have a new set of strategic initiatives each with their own J-curve ahead, and you carry at least 10 months of runway so you can negotiate from a position of strength rather than urgency.
The Takeaway
The founders who navigate cash flow negativity well treat it as a management variable, not a verdict. They know their burn ratio, can explain their unit economics, and keep enough runway to be wrong once without dying. And they understand that when investors see a startup burning cash they are reading the story that number tells about where the company is headed, not the number in isolation.
Negative cash flow in startups causes panic for a reason, but a red figure in a spreadsheet tells you almost nothing on its own. What matters is the trend behind it.
If you are a digital health or B2B software founder building through the J-curve with a clear plan, we’d like to hear from you at gohub.vc/apply